Curriculum
ECO 301 Microeconomics
Starting Course
0/13Chapter 1 The Scope and Method of Economics
• economics The study of how individuals and societies choose to use the scarce resources that nature and previous generations have provided.
• The key word in the definition is choose.
• Economics is a behavioral, or social, science.
• Economics is the study of how people make choices.
Why Study Economics?
To Learn a Way of Thinking
• Economics has three fundamental concepts:
– Opportunity cost
– Marginalism
– Efficient markets
To Learn a Way of Thinking (1 of 3)
Opportunity Cost
• opportunity cost The best alternative that we forgo, or give up, when we make a choice or decision.
• scarce Limited.
• For example, say a man wanted to go to the cinema this evening but also wanted to have a BBQ with his friends. If he went and watched a film in the cinema the opportunity cost to the man would be the time and enjoyment lost out by not having a BBQ with his friends.
Opportunity Costs
• Opportunity cost is an important economic concept that is inherent in the decision-making of individuals, businesses and other entities.
• The famous saying that ‘there is no such thing as a free lunch’ is exactly what opportunity cost is all about. If someone invites you out for a free lunch, is it completely free? Absolutely not. The potential opportunities that you could be doing whilst having this lunch have been sacrificed – which comes at a cost – an opportunity cost.
Opportunity Costs
• Individuals encounter opportunity costs every day. Should you carry on reading this article instead of watching your favorite TV program? In every decision you make you will have weighed up the benefits of choosing each option and calculated which option will give the lowest opportunity cost.
• Opportunity cost is an important concept because it shows why people make certain choices. For example, if someone chooses to go to university for three years they must think that studying for this period of time will be worth the opportunity cost of not having a job for three years which provides paid employment and work experience.
Opportunity Cost
• Businesses and corporations are also faced with opportunity costs. If a business decides to invest $50,000 into a new factory in order to expand its production, there are large opportunity costs involved. The money could be spent on new equipment in order to increase productivity (the efficiency of the use of resources). On the other hand, there is also an opportunity cost of not keeping the money in a bank account where it will collect interest payments.
Opportunity Cost
• Businesses also face opportunity costs when deciding to shut down or change a part of its operations. For example if a retail business wants to move one of its stores from the centre of the city to the middle of the countryside the opportunity costs will be the lost profits of the store in the city. If the store in the city made $10,000 a week of profit and the new store in the countryside is making $15,000 a week profit then you may think that the decision to close the store in the city has resulted in large benefit of $15,000 a week. However, by not having the store in the city, the business is no longer making that £10,000 a week so the actual economic profit from this decision is £5,000 ($15,000 minus $10,000) due to the opportunity cost involved.
To Learn a Way of Thinking
Marginalism
• marginalism The process of analyzing the additional or incremental costs or benefits arising from a choice or decision.
To Learn a Way of Thinking
Efficient Markets—No Free Lunch
• efficient market A market in which profit opportunities are eliminated almost instantaneously.
• The study of economics teaches us a way of thinking and helps us make decisions.
Efficient Markets—No Free Lunch
• efficient market A market in which profit opportunities are eliminated almost instantaneously by new firms entering and charging a lower price. This will cause a market equilibrium where price = marginal cost so no profit is made.
The Scope of Economics
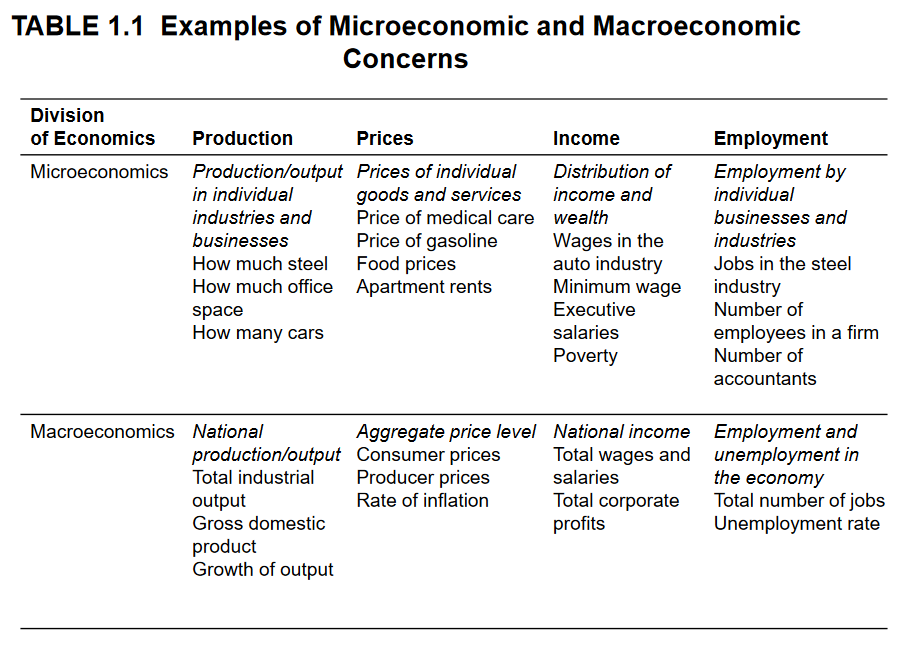
Microeconomics and Macroeconomics
• microeconomics The branch of economics that examines the functioning of individual industries and the behavior of individual decision-making units—that is, firms and households.
• macroeconomics The branch of economics that examines the economic behavior of aggregates—income, employment, output, and so on—on a national scale.
The Scope of Economics
Microeconomics and Macroeconomics
• Microeconomics looks at the individual unit—the household, the firm, the industry. It sees and examines the “trees.”
• Macroeconomics looks at the whole, the aggregate. It sees and analyzes the “forest.”
Absolute Advantage
• An absolute advantage is when a person, firm or country can produce more of a good or service using the same amount of resources. (such as raw materials or wages for workers). In other words, if an entity can produce a good or service more efficiently, it has an absolute advantage in that good or service.
• For example, lets say a business in the United Kingdom and a business in Australia both produce apples. The UK business can produce 15 apples for every hour of labor worked and the Australian business can produce just 10 apples for every hour of labor worked. Therefore the UK has an absolute advantage in producing apples because it can produce more of them using the same amount of labor.
Absolute Advantage
• For example, let’s say I share a flat with another person and we take it in turns to clean every Monday. I can clean the whole flat in 2 hours but my flat mate can clean the flat in just 1 hour. This means my flat mate has an absolute advantage in cleaning the flat.
Comparative Advantage
• Comparative Advantage is when a person or country can produce a good or service at a lower opportunity cost than anyone else they have a comparative advantage in that good or service.
• For an example let’s take two activities, gardening and cleaning, and let’s also take an imaginary couple, Peter and Jane. Peter and Jane want to get the house and garden looking nice for a garden party tomorrow. Peter is an amazing gardener and is a lot faster at gardening than Jane. Peter is also a pretty good cleaner and cleans a little bit faster than Jane. From this situation we can see that Peter has an absolute advantage in both gardening and cleaning because he is better at them than Jane is.
Comparative Advantage
• You may think that it would be most sensible if Peter did both the gardening and cleaning because he is best at them. But this is where the theory of comparative advantage comes in. While Peter gardens a lot faster than Jane, he only cleans a little bit faster than her. The opportunity cost of cleaning for Jane is quite low because the time spent cleaning can’t be used much better in the garden. However, the opportunity cost of cleaning for Peter is quite high – every hour spent cleaning could be spent doing gardening which he is much better at. Therefore Jane has a comparative advantage in cleaning because she can clean with lower opportunity costs than Peter.
Comparative Advantage
• The theory of comparative advantage is significant because it supports free trade. In the example above, if Peter focused on doing the gardening and Jane focused on doing the cleaning then the garden and house would be ready much faster. Likewise, on an international scale, if countries focus on their comparative advantage and trade goods and services with other countries, everyone will benefit.
Industrial Revolution
• Industrial Revolution The period in England during the late eighteenth and early nineteenth centuries in which new manufacturing technologies and improved transportation gave rise to the modern factory system and a massive movement of the population from the countryside to the cities.
Capital
• Capital, as economists use the term refers to things that have already been produced that are in turn used to produce other goods and services.
Scarcity and Choice in a One-Person Economy
Opportunity Cost
• The concepts of constrained choice and scarcity are central to the discipline of economics.
• opportunity cost The best alternative that we give up, or forgo, when we make a choice or decision.
Price and Quantity Demanded: The Law of Demand
• demand schedule Shows how much of a given product a household would be willing to buy at different prices for a given time period.
• demand curve A graph illustrating how much of a given product a household would be willing to buy at different prices.
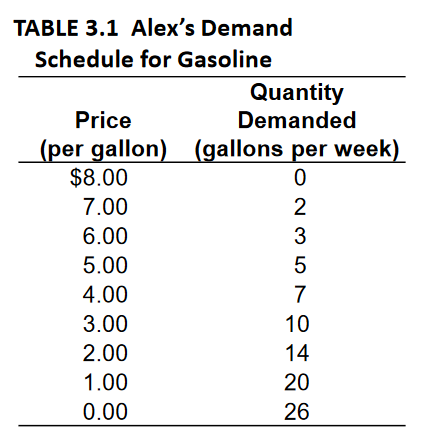
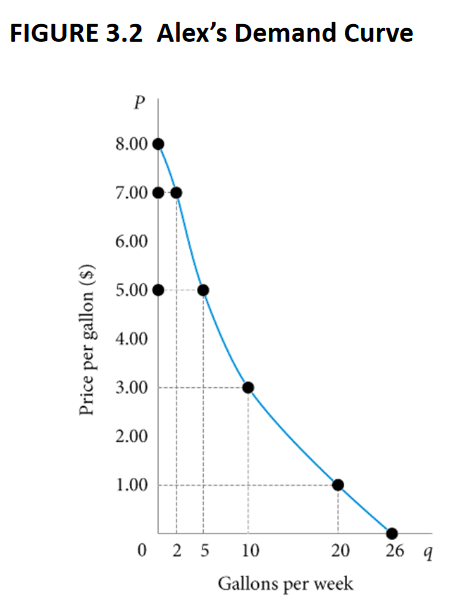
• The relationship between price (P) and quantity demanded (q) presented graphically is called a demand curve.
• Demand curves have a negative slope, indicating that lower prices cause quantity demanded to increase.
• Note that Alex’s demand curve is blue; demand in product markets is determined by household choice.
Price and Quantity Demanded: The Law of Demand
Demand Curves Slope Downward
• law of demand The negative relationship between price and quantity demanded: Ceteris paribus, as price rises, quantity demanded decreases; as price falls, quantity demanded increases during a given period of time, all other things remaining constant.
• It is reasonable to expect quantity demanded to fall when price rises, ceteris paribus, and to expect quantity demanded to rise when price falls, ceteris paribus.
• A demand curve has a negative slope.
Price and Quantity Demanded: The Law of Demand
Other Properties of Demand Curves
• To summarize what we know about the shape of demand curves:
1. They have a negative slope.
2. They intersect the quantity (X) axis, a result of time limitations and diminishing marginal utility.
3. They intersect the price (Y) axis, a result of limited income and wealth.
• The actual shape of an individual household demand curve depends on the unique tastes and preferences of the household and other factors.
Other Determinants of Household Demand
Income and Wealth
• income The sum of all a household’s wages, salaries, profits, interest payments, rents, and other forms of earnings in a given period of time. It is a flow measure.
• wealth or net worth The total value of what a household owns minus what it owes. It is a stock measure.
Other Determinants of Household Demand
Income and Wealth
• normal goods Goods for which demand goes up when income is higher and for which demand goes down when income is lower.
• inferior goods Goods for which demand tends to fall when income rises.
Other Determinants of Household Demand
Prices of Other Goods and Services
• substitutes Goods that can serve as replacements for one another; when the price of one increases, demand for the other increases.
• perfect substitutes Identical products.
• complements, complementary goods Goods that “go together”; a decrease in the price of one results in an increase in demand for the other and vice versa.
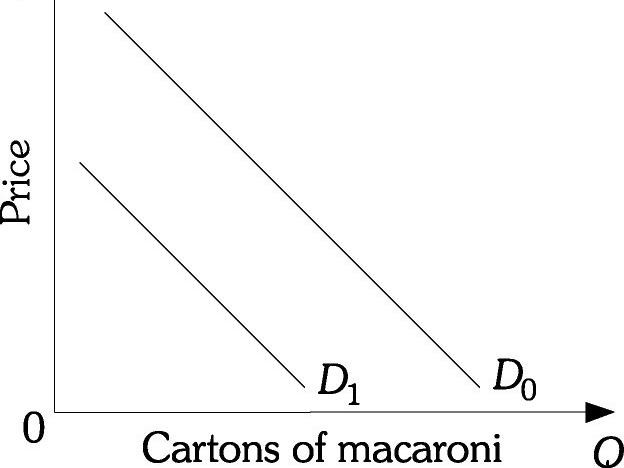
Increase in Demand NOT because it is cheaper
Let’s say people make more money in general (income goes up) then everyone buys more macaroni even though the price stays the same, therefore demand curve D1 moves forward to to Do. If everyone makes less money (income goes down) the demand curve goes backward from Do to D1.
Shifts of Demand versus Movement along a Demand Curve
• shift of a demand curve The change that takes place in a demand curve corresponding to a new relationship between quantity demanded of a good and price of that good. The shift is brought about by a change in the original conditions.
• movement along a demand curve The change in quantity demanded brought about by a change in price.
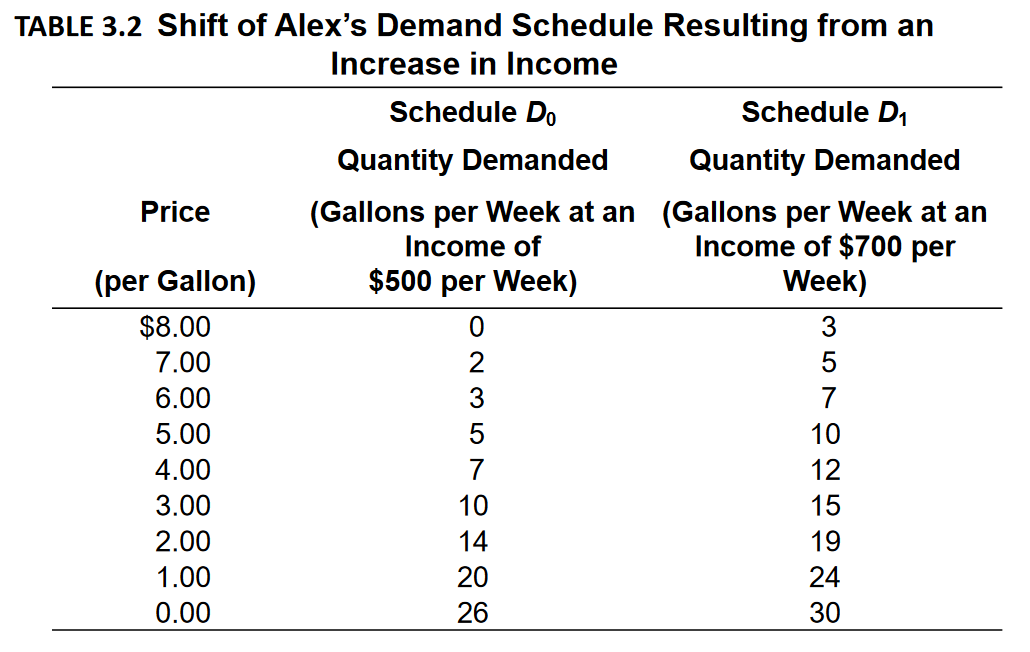
FIGURE 3.3 Shift of a Demand Curve Following a Rise in Income
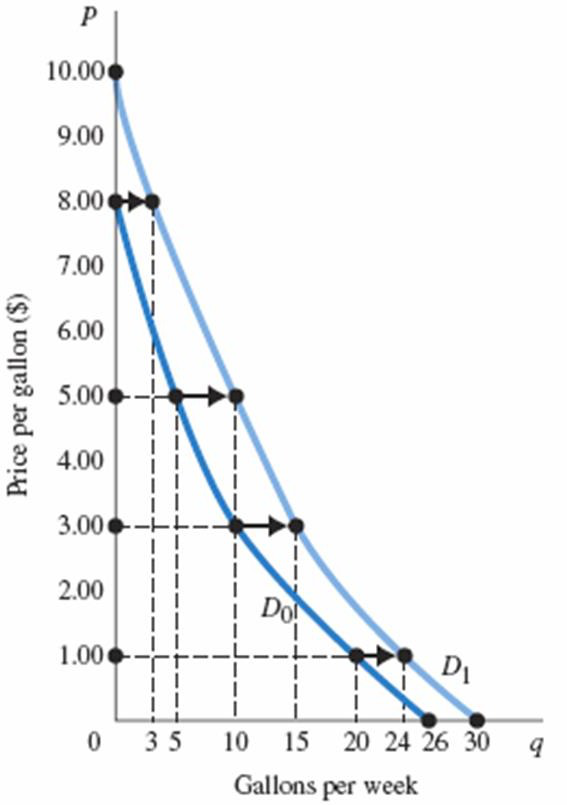
• When the price of a good changes, we move along the demand curve for that good.
• When any other factor that influences demand changes (income, tastes, and so on), the demand curve shifts, in this case from D0 to D1.
• Gasoline is a normal good, so an income increase shifts the curve to the right.
Shifts of Demand versus Movement along a Demand Curve
• Change in price of a good or service leads to –> change in quantity demanded (movement along a demand curve).
• Change in income, preferences, or prices of other goods or services leads to –> change in demand (shift of a demand curve).
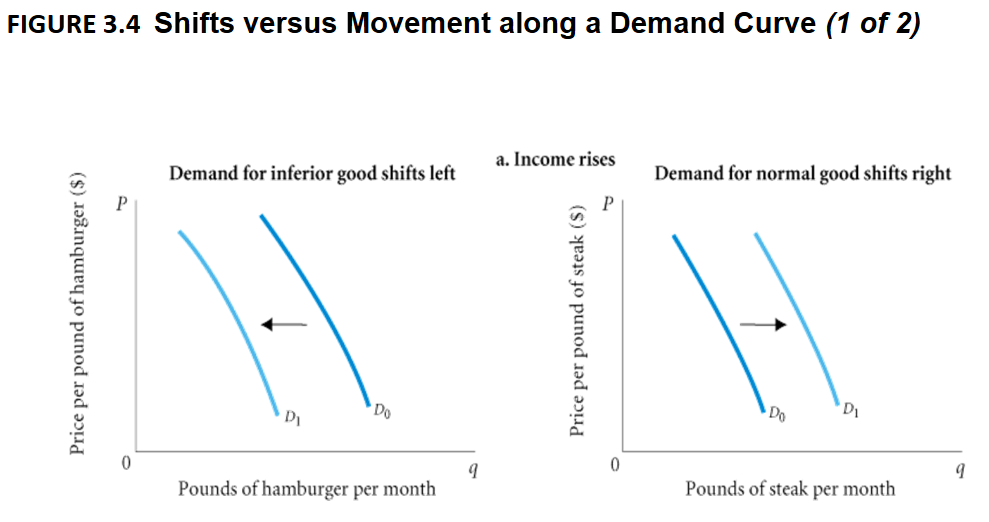
• a. When income increases, the demand for inferior goods shifts to the left, and the demand for normal goods shifts to the right.
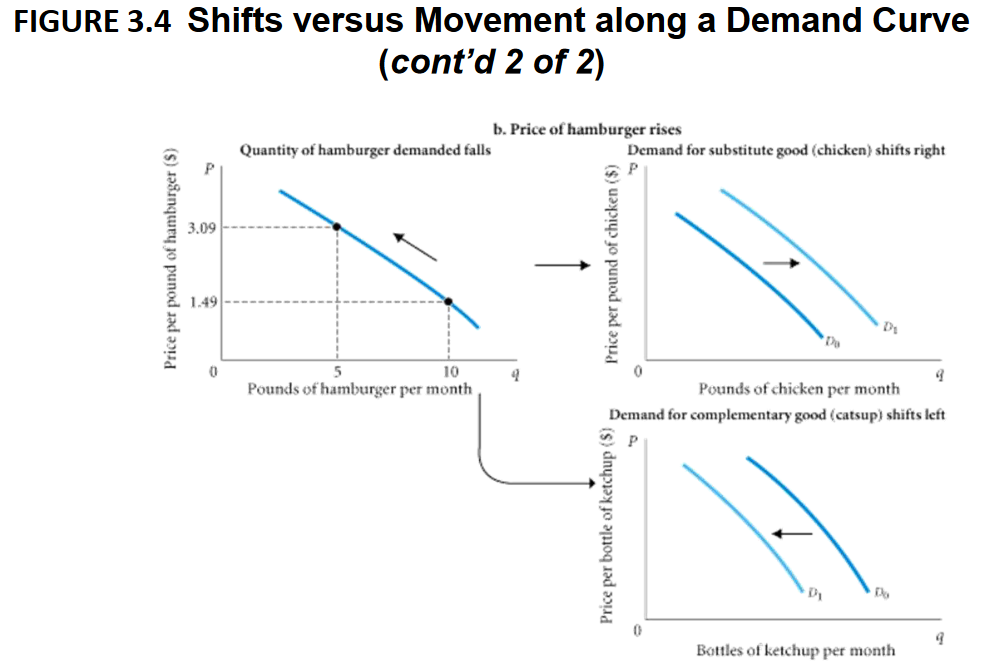
b. If the price of hamburger rises, the quantity of hamburger demanded declines; this is a movement along the demand curve. The same price rise for hamburger would shift the demand for chicken (a substitute for hamburger) to the right and the demand for ketchup (a complement to hamburger) to the left.
From Household Demand to Market Demand
• market demand The sum of all the quantities of a good or service demanded per period by all the households buying in the market for that good or service.
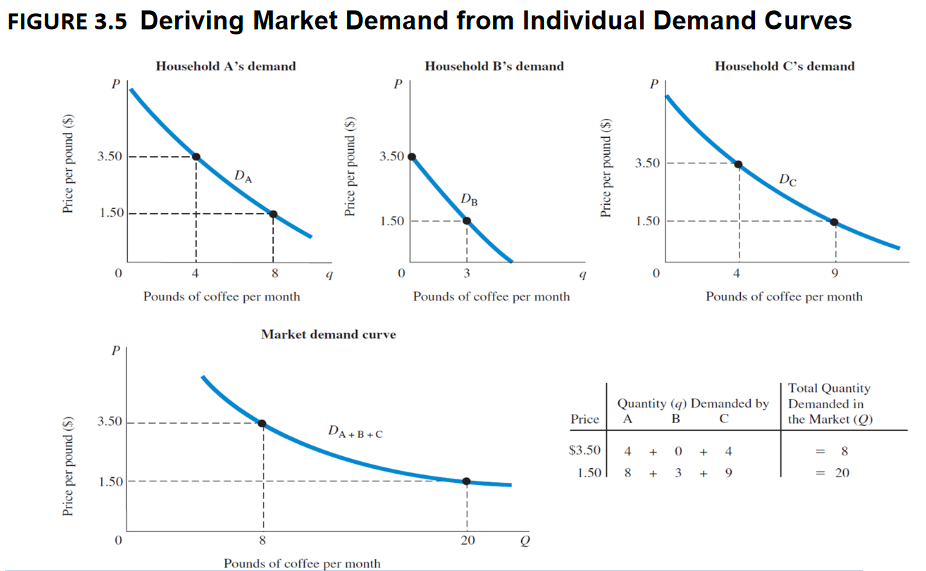
• Total demand in the marketplace is simply the sum of the demands of all the households shopping in a particular market. It is the sum of all the individual demand curves—that is, the sum of all the individual quantities demanded at each price.
Price and Quantity Supplied: The Law of Supply
• quantity supplied The amount of a particular product that a firm would be willing and able to offer for sale at a particular price during a given time period.
• supply schedule Shows how much of a product firms will sell at alternative prices.
Price and Quantity Supplied: The Law of Supply
• law of supply The positive relationship between price and quantity of a good supplied: An increase in market price, ceteris paribus, will lead to an increase in quantity supplied, and a decrease in market price will lead to a decrease in quantity supplied.
• supply curve A graph illustrating how much of a product a firm will sell at different prices.
Demand and Supply in Product Markets: A Review
• Important points to remember about the mechanics of supply and demand in product markets:
1. A demand curve shows how much of a product a household would buy if it could buy all it wanted at the given price. A supply curve shows how much of a product a firm would supply if it could sell all it wanted at the given price.
2. Quantity demanded and quantity supplied are always per time period—that is, per day, per month, or per year.
3. The demand for a good is determined by price, household income and wealth, prices of other goods and services, tastes and preferences, and expectations.
Demand and Supply in Product Markets: A Review
4. The supply of a good is determined by price, costs of production, and prices of related products. Costs of production are determined by available technologies of production and input prices.
5. Be careful to distinguish between movements along supply and demand curves and shifts of these curves. When the price of a good changes, the quantity of that good demanded or supplied changes—that is, a movement occurs along the curve. When any other factor changes, the curve shifts, or changes position.
6. Market equilibrium exists only when quantity supplied equals quantity demanded at the current price.
Market Equilibrium
• equilibrium The condition that exists when quantity supplied and quantity demanded are equal. At equilibrium, there is no tendency for price to change.
Excess Demand
• excess demand or shortage The condition that exists when quantity demanded exceeds quantity supplied at the current price.
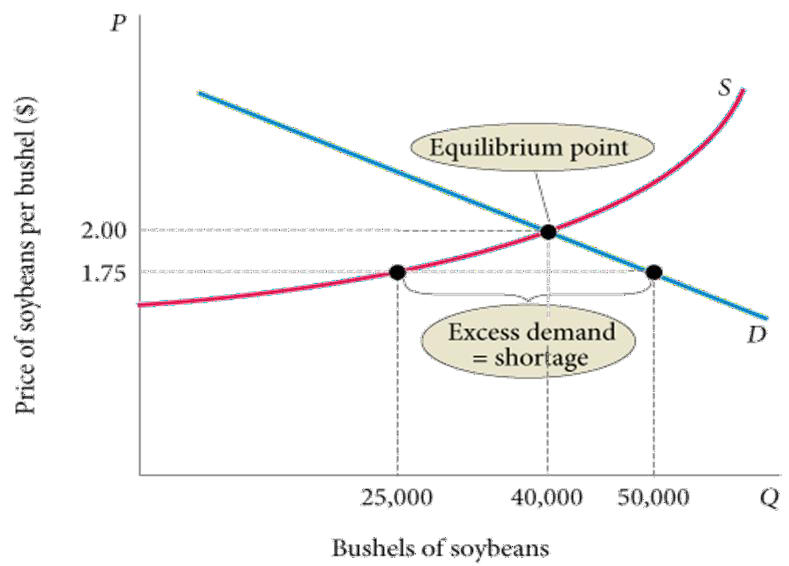
• At a price of $1.75 per bushel, quantity demanded exceeds quantity supplied.
• When excess demand exists, there is a tendency for price to rise.
• When quantity demanded equals quantity supplied, excess demand is eliminated and the market is in equilibrium.
• Here the equilibrium price is $2.00, and the equilibrium quantity is 40,000 bushels.
• Here the equilibrium price is $2.00, and the equilibrium quantity is 40,000 bushels.
The Price System: Rationing and Allocating Resources
Price Rationing
• price rationing The process by which the market system allocates goods and services to consumers when quantity demanded exceeds quantity supplied.
• The adjustment of price is the rationing mechanism in free markets.
• Price rationing means that whenever there is a need to ration a good—that is, when a shortage exists—in a free market, the price of the good will rise until quantity supplied equals quantity demanded—that is, until the market clears.
Constraints on the Market and Alternative Rationing Mechanisms
• On occasion, both governments and private firms decide to use some mechanism other than the market system to ration an item for which there is excess demand at the current price.
• Policies designed to stop price rationing are justified in a number of ways, most often in the name of fairness.
Constraints on the Market and Alternative Rationing Mechanisms
• Regardless of the rationale, two things are clear:
• 1. Attempts to bypass price rationing in the market and to use alternative rationing devices are more difficult and more costly than they would seem at first glance.
• 2. Very often such attempts distribute costs and benefits among households in unintended ways.
Constraints on the Market and Alternative Rationing Mechanisms
Oil, Gasoline, and OPEC
• The Organization of the Petroleum Exporting Counties (OPEC) is an organization of 12 countries that together produce about one-third of the world’s oil today.
• In 1973 and 1974, OPEC imposed an embargo on shipments of crude oil to the United States. Congress responded by imposing a maximum price of $0.57 per gallon of leaded regular gasoline. This created a shortage as the price system was not allowed to function.
• Alternative rationing systems also occurred.
FIGURE 4.3 Excess Demand (Shortage) Created by a Price Ceiling
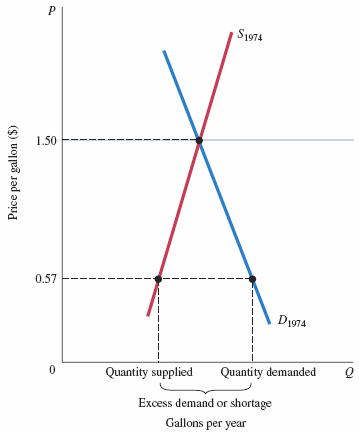
• In 1974, a ceiling price of $0.57 per gallon of leaded regular gasoline was imposed.
• If the price had been set by the interaction of supply and demand instead, it would have increased to approximately $1.50 per gallon.
• At $0.57 per gallon, the quantity demanded exceeded the quantity supplied.
• Because the price system was not allowed to function, an alternative rationing system had to be found to distribute the available supply of gasoline.
Constraints on the Market and Alternative Rationing Mechanisms
• price ceiling A maximum price that sellers may charge for a good, usually set by government.
• queuing Waiting in line as a means of distributing goods and services: a nonprice rationing mechanism.
• favored customers Those who receive special treatment from dealers during situations of excess demand.
Constraints on the Market and Alternative Rationing Mechanisms
• ration coupons Tickets or coupons that entitle individuals to purchase a certain amount of a given product per month.
• black market A market in which illegal trading takes place at market-determined prices.
Constraints on the Market and Alternative Rationing Mechanisms
Rationing Mechanisms for Concert and Sports Tickets
• It is very difficult to prevent the price system from operating and to stop people’s willingness to pay from asserting itself.
• Every time an alternative is tried, the price system seems to sneak in the back door.
• With favored customers and black markets, the final distribution may be even more unfair than what would result from simple price rationing.
Prices and the Allocation of Resources
• Price changes resulting from shifts of demand in output markets cause profits to rise or fall. Profits attract capital; losses lead to disinvestment.
• Higher wages attract labor and encourage workers to acquire skills.
• At the core of the system, supply, demand, and prices in input and output markets determine the allocation of resources and the ultimate combinations of goods and services produced
Supply and Demand and Market Efficiency
• Supply and demand curves can be used to illustrate market efficiency, which can be understood through the concepts of consumer and producer surplus.
Consumer Surplus
• consumer surplus The difference between the maximum amount a person is willing to pay for a good and its current market price.
How price adjusts to eliminate excess demand.
• When there is excess demand, quantity demanded is greater than quantity supplied. Therefore, the price will rise. As the price rises, quantity demanded falls and quantity supplied rises. Price will continue to rise until quantity demanded and quantity supplied are equal (at the market equilibrium
Types of Elasticity
• perfectly inelastic demand Demand in which quantity demanded does not respond at all to a change in price.
• perfectly elastic demand Demand in which quantity drops to zero at the slightest increase in price.
Types of Elasticity
• A good way to remember the difference between the two perfect elasticities is:

FIGURE 5.2 Perfectly Inelastic and Perfectly Elastic Demand Curves
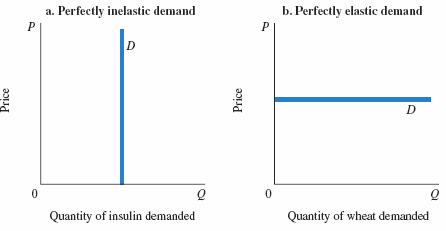
• Panel (a) shows a perfectly inelastic demand curve for insulin. Price elasticity of demand is zero. Quantity demanded is fixed; it does not change at all when price changes.
• Panel (b) shows a perfectly elastic demand curve facing a wheat farmer. A tiny price increase drives the quantity demanded to zero. In essence, perfectly elastic demand implies that individual producers can sell all they want at the going market price but cannot charge a higher price.
Types of Elasticity
• elastic demand A demand relationship in which the percentage change in quantity demanded is larger than the percentage change in price in absolute value (a demand elasticity with an absolute value greater than 1).
• inelastic demand Demand that responds somewhat, but not a great deal, to changes in price. Inelastic demand always has a numerical value between 0 and 1.
Types of Elasticity
• unitary elasticity A demand relationship in which the percentage change in quantity of a product demanded is the same as the percentage change in price in absolute value (a demand elasticity with an absolute value of 1).
• Because it is generally understood that demand elasticities are negative (demand curves have a negative slope), they are often reported and discussed without the negative sign.
Total Revenue and Elasticity
• Total Revenue is the total amount of money you make when you sell goods at a certain price.
– When a product is elastic and its price rises, total revenue decreases.
– When a product is inelastic and its price rises, total revenue increases.
– When a product is inelastic and its price falls, total revenue decreases.
– When a product is unit elastic and its price changes, total revenue remains constant.
Elasticity changes along a Demand Curve
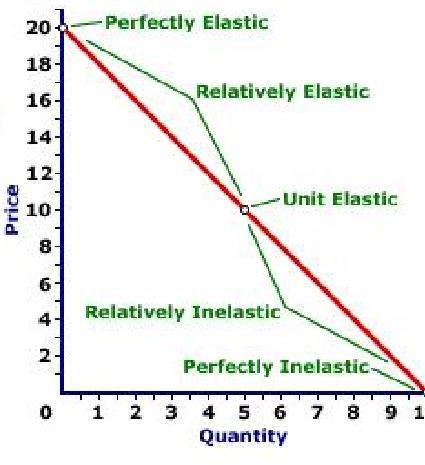
Elasticity along a demand curve
• Although the slope doesn’t change in a normal downward sloping demand curve, it becomes more inelastic as price decreases and quantity increases.
Marginal Utility
• Marginal Utility measures the value of one more unit of a good. Marginal utility decreases when a person doesn’t need any more of the good.
– For example, the marginal utility for a second copy of the same book or magazine is low, while the marginal utility for the same bottle of wine is high for an alcoholic.
The Budget Constraint
• budget constraint The limits imposed on household choices by income, wealth, and product prices.
• choice set or opportunity set The set of options that is defined and limited by a budget constraint.
The Budget Constraint
Preferences, Tastes, Trade-offs, and Opportunity Cost
• Within the constraints imposed by limited incomes and fixed prices, households are free to choose what they will and will not buy.
• A household makes a choice by weighing the good or service that it chooses against all the other things that the same money could buy.
• With a limited budget, the real cost of any good or service is the value of the other goods and services that could have been purchased with the same amount of money.
The Budget Constraint
The Budget Constraint More Formally
• Both prices and income affect the size of a household’s opportunity set.
• real income The set of opportunities to purchase real goods and services available to a household as determined by prices and money income.
Budget Constraint
• Tom has enough money to buy 40 hot dogs a month or 20 hamburgers a month. He can also chose to buy a “bundle” which is a combination of hot dogs and hamburgers. The different combinations possible is called his budget constraint and is represented by the line which goes from 40 to 20 on the next slide.
Budget Constraint
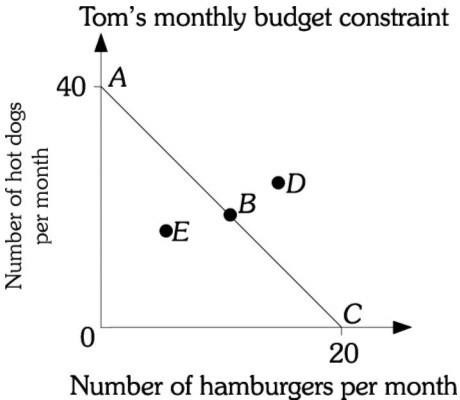
Budget Constraint
• At point A, Tom eats only hot dogs
• At point B, Tom eats half hot dogs, and half hamburgers
• At point C, Tom eats only hamburgers.
• Tom doesn’t have enough money to buy bundle “D”
• At point E, Tom has extra money left over.
Budget Constraint
• If a hot dog costs $1, We can see from the graph that Tom makes $40 (he can buy 40 hot dogs) per month and a hamburger costs $2 (he can buy 20 hamburgers).
The Production Process: The Behavior of Profit-Maximizing Firms
• All firms demand inputs, engage in production, and produce output.
• Firms also have an incentive to maximize profits and minimize costs.
• production The process by which inputs are combined, transformed, and turned into outputs.
• firm An organization that comes into being when a person or a group of people decides to produce a good or service to meet a perceived demand.
Profits and Economics Costs
• profit The difference between total revenue and total cost.
profit = total revenue − total cost
• total revenue The amount received from the sale of the product (q × P).
• total cost The total of (1) out-of-pocket costs and (2) opportunity cost of all factors of production.
Profits and Economics Costs
• The term profit will from here on refer to economic profit.
• So whenever we say profit = total revenue − total cost, what we really mean is:
economic profit = total revenue − total economic cost
• economic profit Profit that accounts for both explicit and opportunity costs.
Profits and Economics Costs
Normal Rate of Return
• The way we treat the opportunity cost of capital is to add a normal rate of return to capital as part of economic cost.
• normal rate of return A rate of return on capital that is just sufficient to keep owners and investors satisfied. For relatively risk-free firms, it should be nearly the same as the interest rate on risk-free government bonds.